Reports
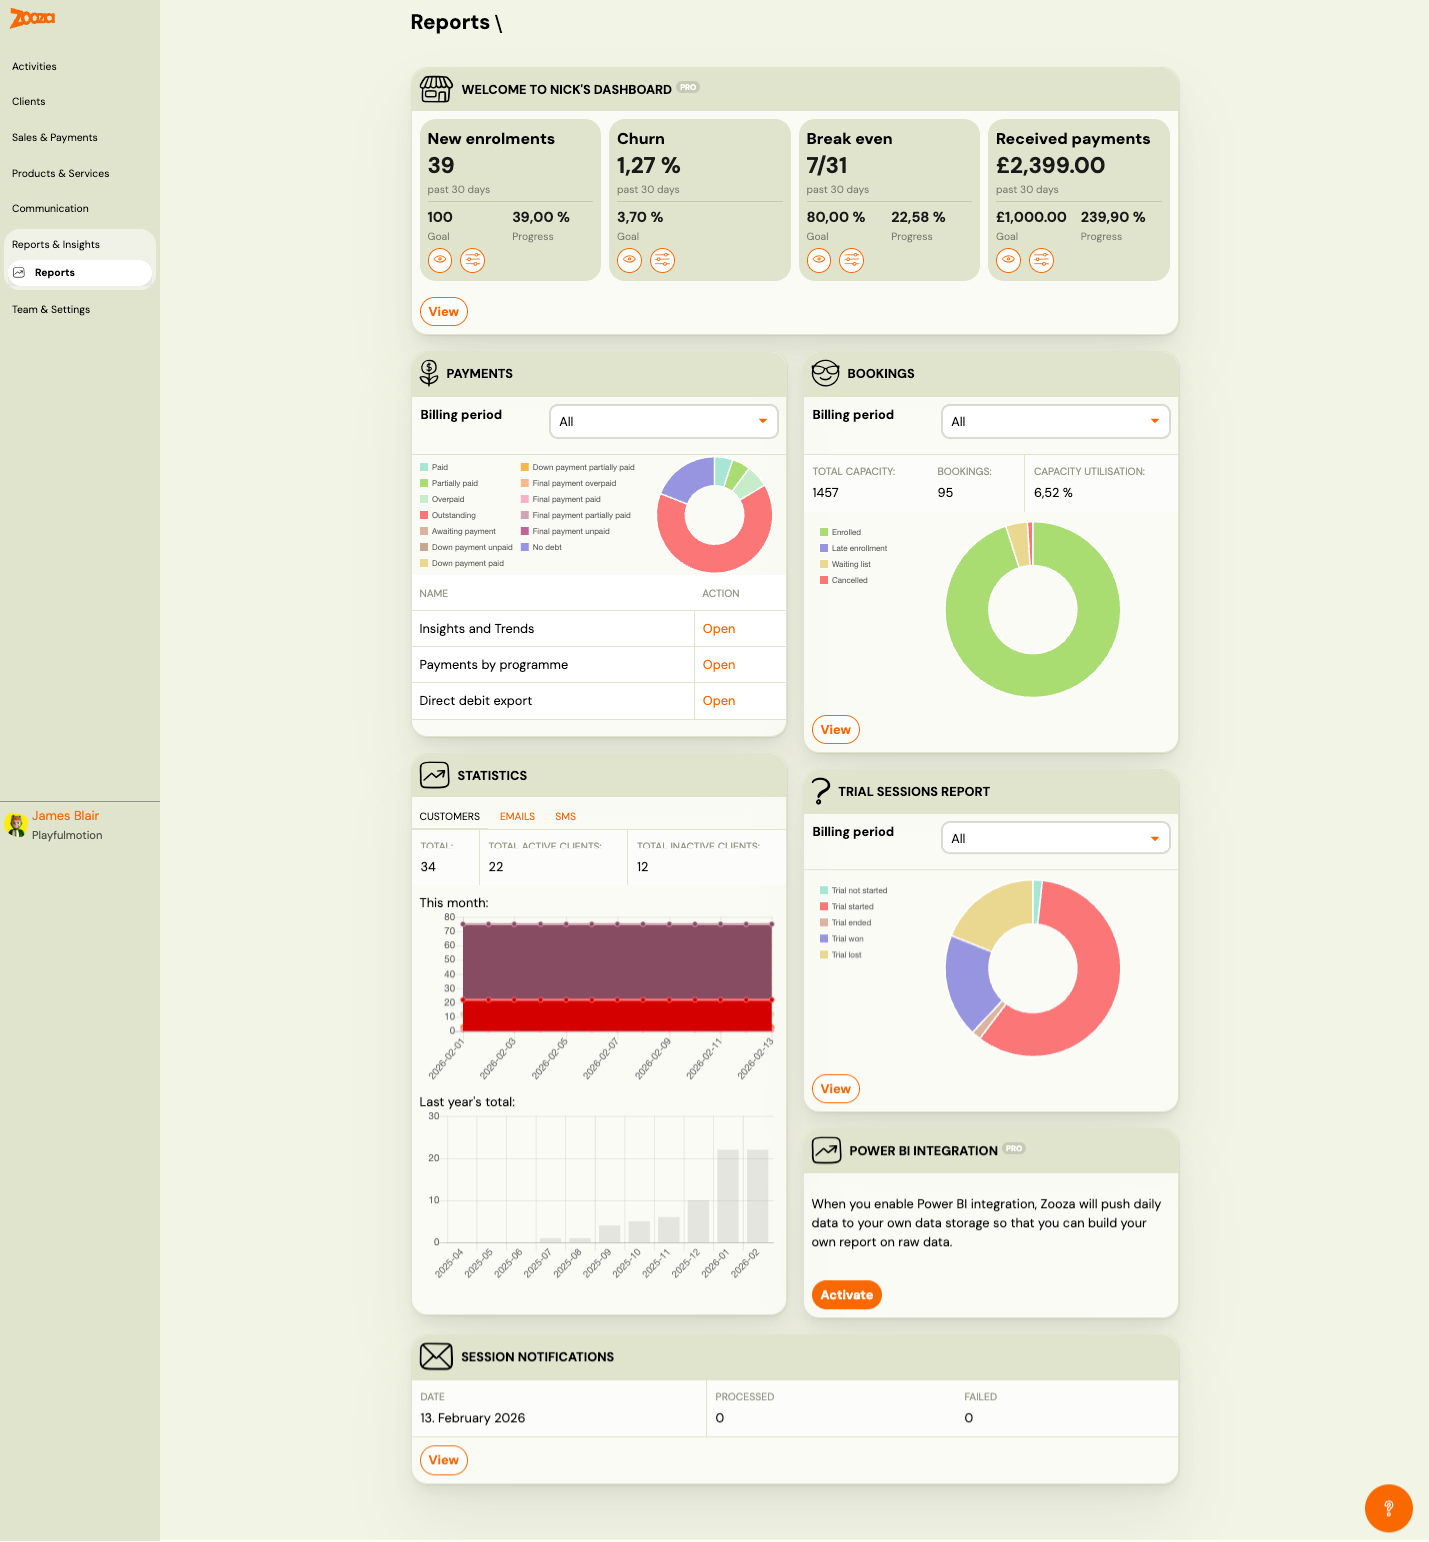
The Reports screen provides an overview of your business metrics, payment status, booking occupancy, client statistics, trial conversion, and session notifications. It includes a personalizable dashboard with goal tracking powered by Nick's Dashboard (PRO).
Navigation: Go to Reports & Insights → Reports.
Nick's Dashboard (PRO)
A personalizable dashboard with four key business metrics tracked over the past 30 days:
| Metric | Description |
|---|---|
| New enrolments | Number of genuinely new and first-time paying clients who booked onto your programme, not including returning clients or children who came for a free trial. |
| Churn | Percentage of clients who did not re-enrol. |
| Break even | Progress toward your break-even point (e.g. "7/31"). |
| Received payments | Total payments received in the period. |
Each metric card shows:
- Current value (past 30 days)
- Goal value
- Progress percentage
- Eye icon (view detail) and settings icon (configure)
Button: View — opens the detailed dashboard with per-programme drill-down.
Dashboard Detail
Navigation: Reports → Nick's Dashboard → View.
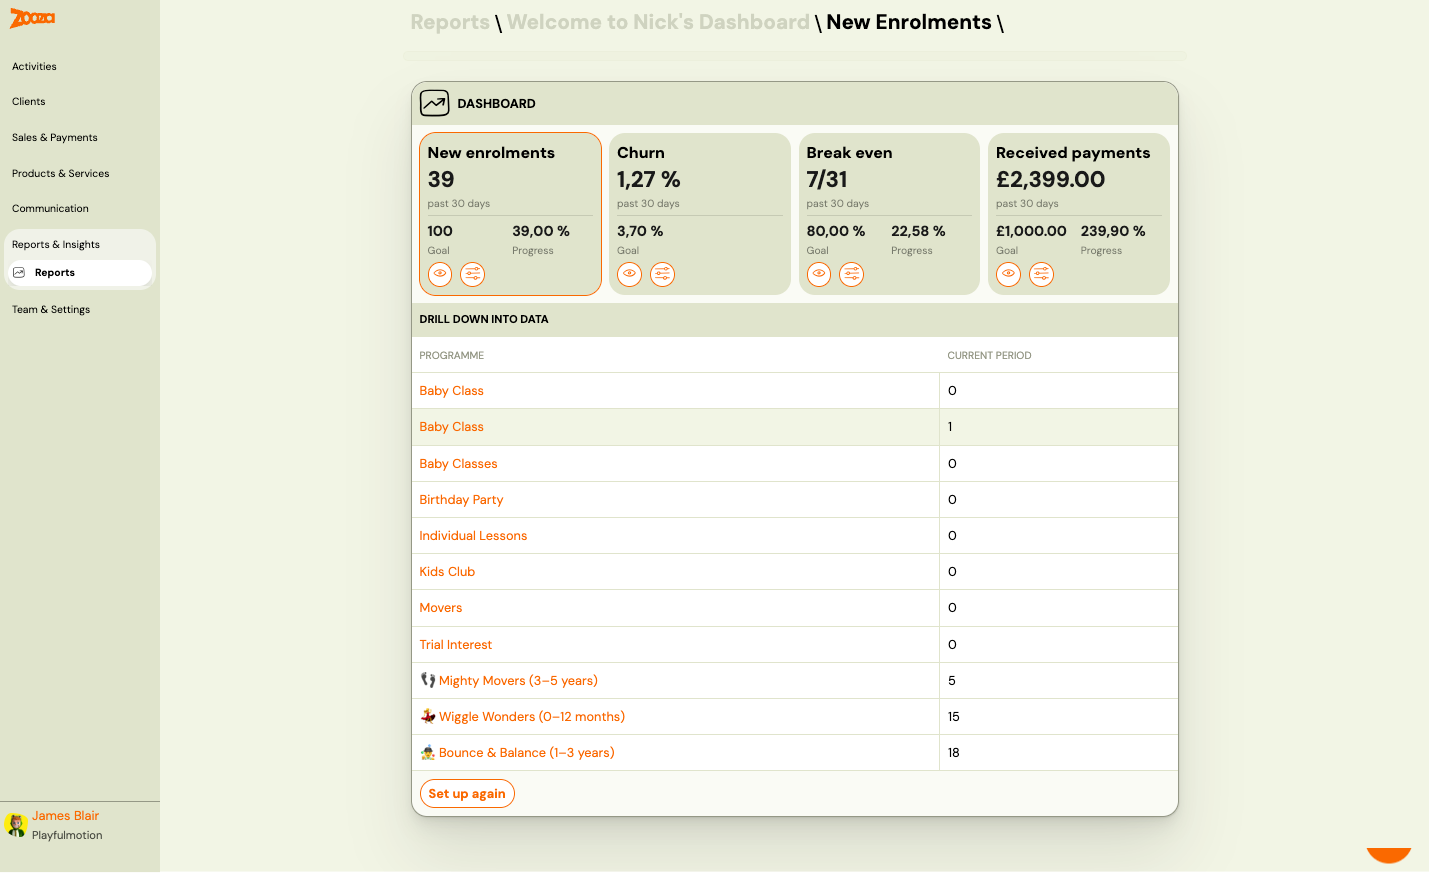
The detail view shows:
- All four metric cards at the top
- Drill down into data — a table listing each programme with its current period value
| Column | Description |
|---|---|
Programme | Programme name (clickable link). |
Current period | Metric value for the current period. |
Button: Set up again — re-run the quick setup wizard.
Quick Setup
Navigation: First visit to Reports, or click Set up again.
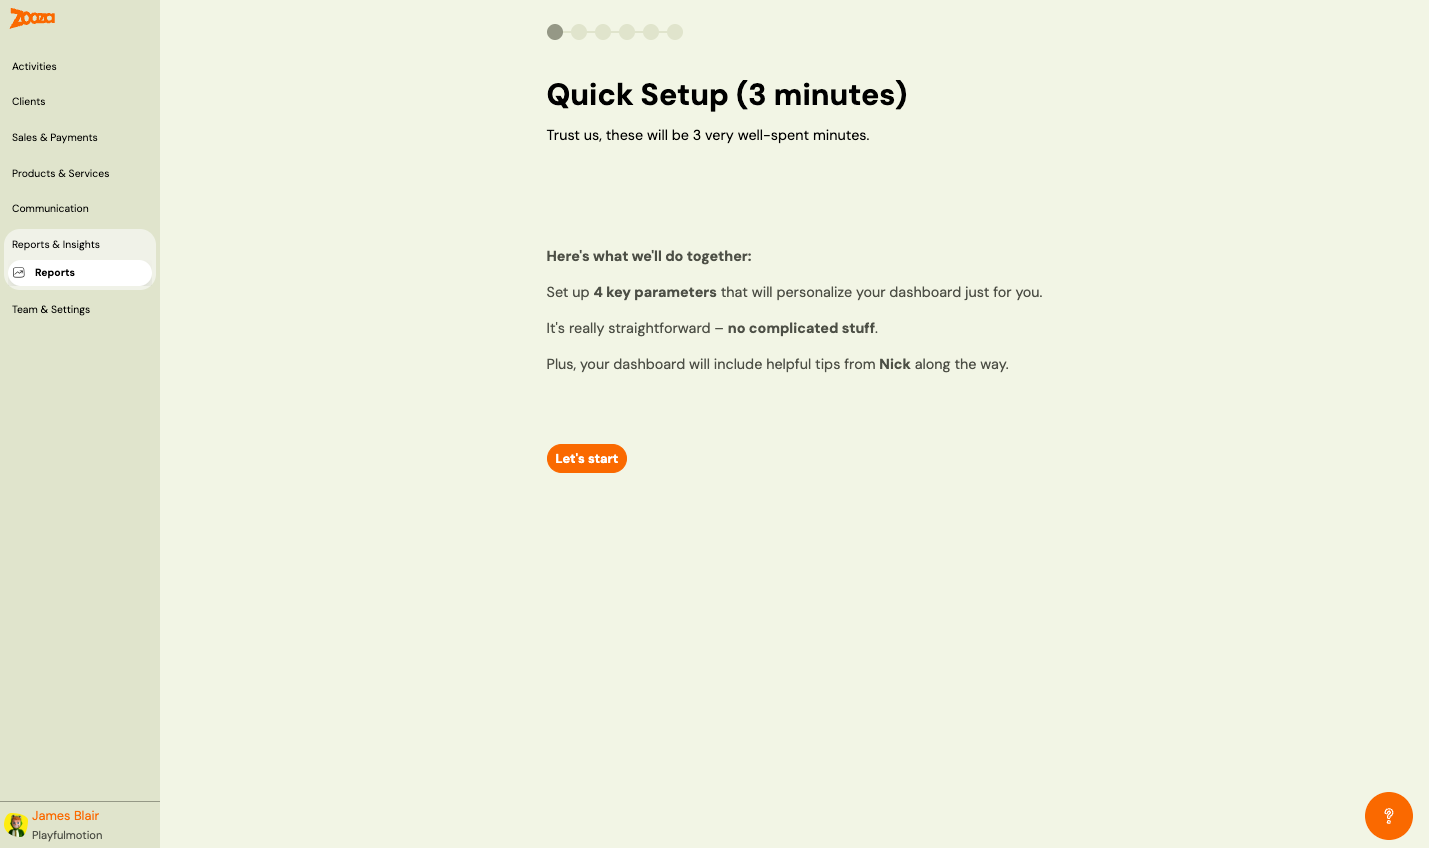
A 6-step wizard to personalize your dashboard. Set up 4 key parameters:
- New Enrolments — select which programme to track and set a monthly target goal.
- Churn — configure churn tracking parameters.
- Break Even — set your break-even targets.
- Received Payments — set payment goals.
Each step shows the metric explanation with tips from Nick Empson (Education franchise expert) and a Learn more about this growth metric link.
Payments
A summary of payment status for a selected billing period.
| Field | Description |
|---|---|
Billing period | Dropdown to select the period (e.g. "All"). |
A donut chart visualizes payment status with the following categories:
- Paid, Partially paid, Overpaid, Outstanding, Awaiting payment, Down payment unpaid, Down payment partially paid, Final payment overpaid, Final payment paid, Final payment partially paid, Final payment unpaid, No debt
Payment Reports
| Report | Description |
|---|---|
| Insights and Trends | Booking and payment trends over time (see Payments Reference). |
| Payments by programme | Income breakdown per programme (see Payments Reference). |
| Direct debit export | Export direct debit data (see Payments Reference). |
Bookings
Booking occupancy overview for a selected billing period.
| Field | Description |
|---|---|
Billing period | Dropdown to select the period. |
Total capacity | Total available spots across all classes. |
Bookings | Number of active bookings. |
Capacity utilisation | Percentage of capacity filled. |
A donut chart shows the breakdown by booking status:
- Enrolled (green)
- Late enrolment (blue)
- Waiting list (yellow)
- Cancelled (red)
Button: View — opens detailed booking report.
Statistics
Client and communication statistics with three tabs:
Clients
| Metric | Description |
|---|---|
Total | Total number of registered clients. |
Total active clients | Clients with at least one active booking. |
Total inactive clients | Clients with no active bookings. |
Two bar charts show:
- This month — daily client activity for the current month.
- Last year's total — monthly client totals for the past 12 months.
Emails
Email sending statistics (tab).
SMS
SMS sending statistics (tab).
Trial Sessions Report
A summary of trial session outcomes for a selected billing period.
| Field | Description |
|---|---|
Billing period | Dropdown to select the period. |
A donut chart shows trial statuses:
- Trial not started
- Trial started (red)
- Trial ended (purple)
- Trial won (green)
- Trial lost (beige)
Button: View — opens the Trial Sessions Report detail.
Trial Sessions Report Detail
Navigation: Reports → Trial Sessions Report → View.
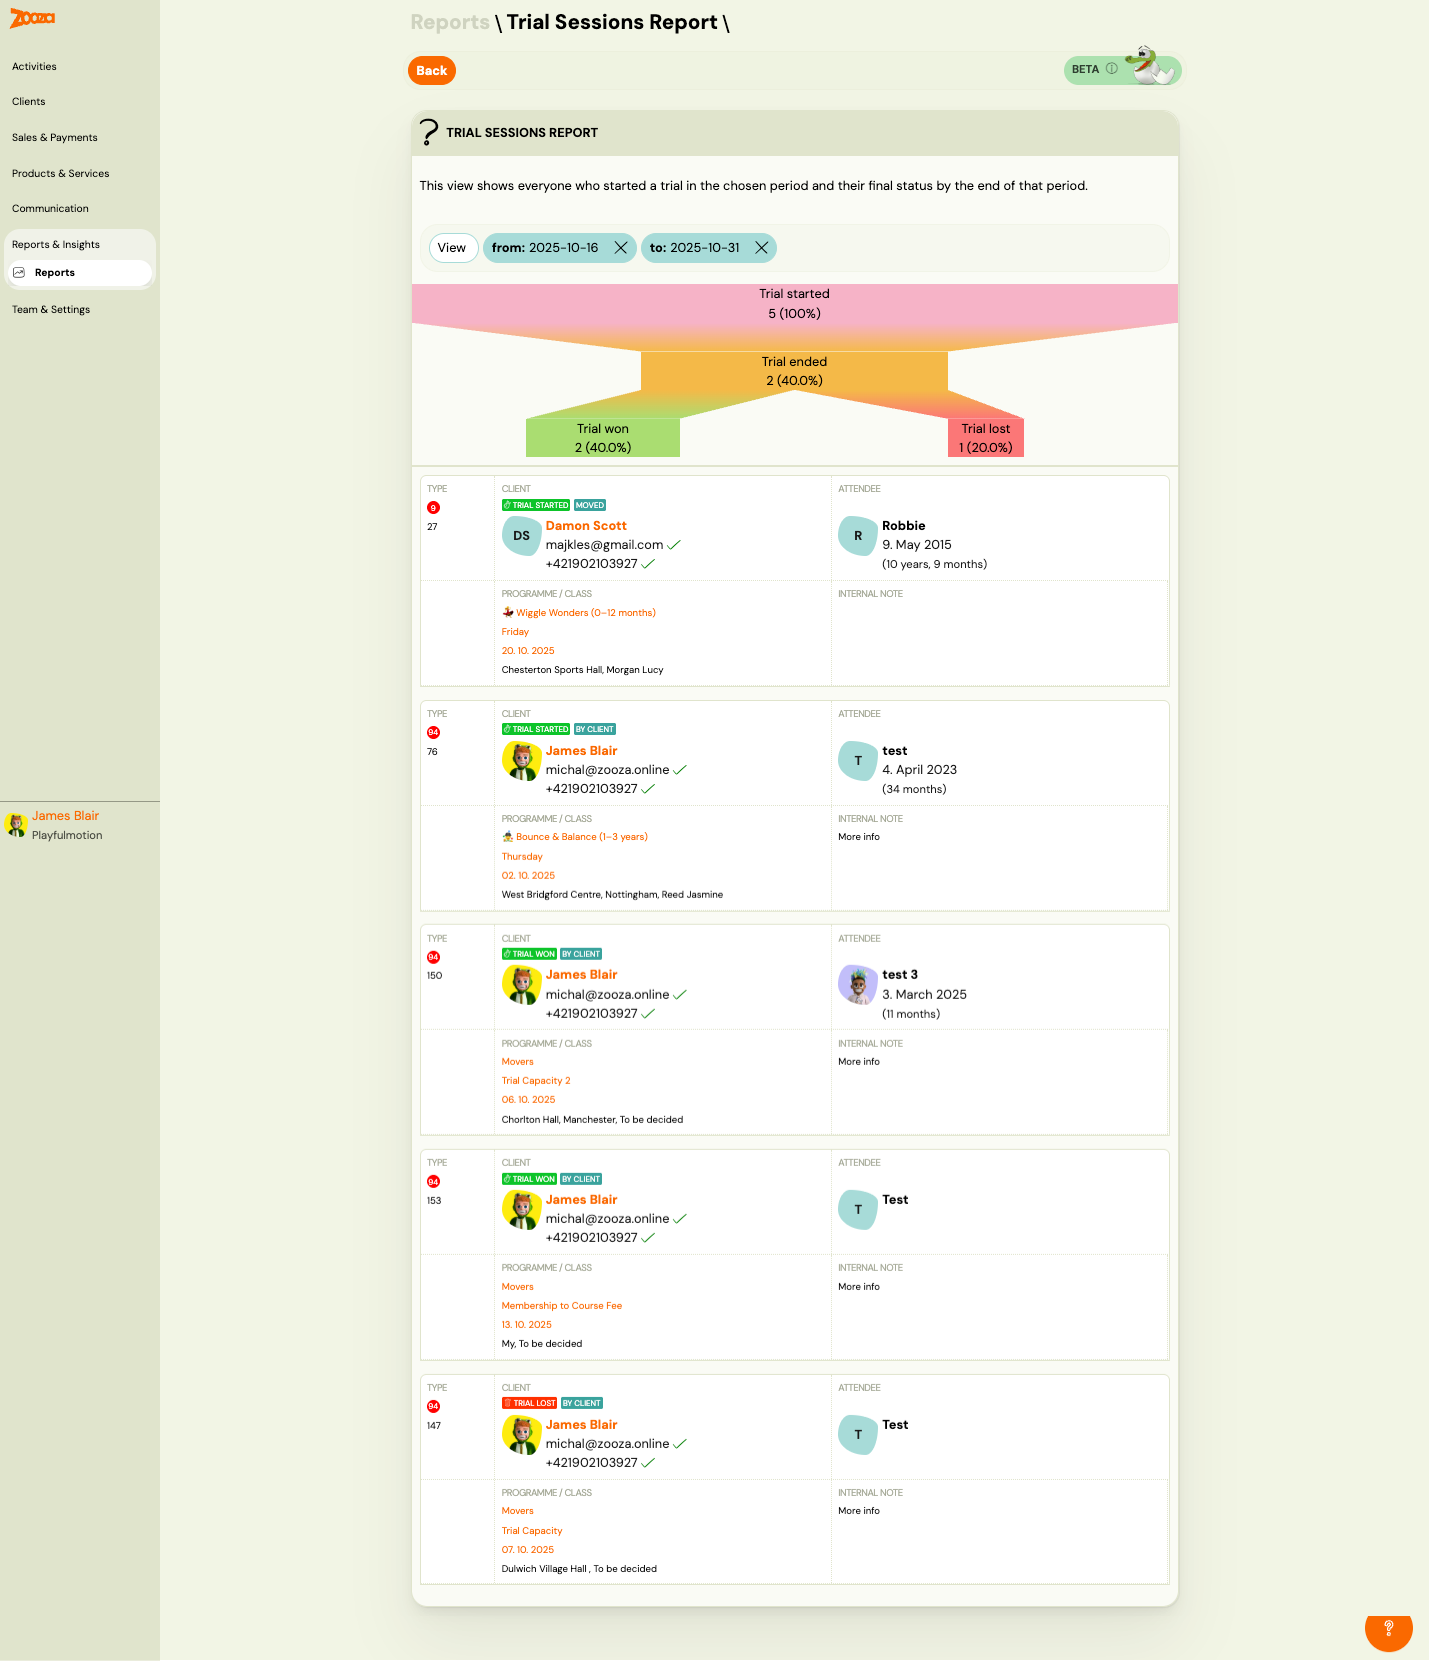
Note: This feature is currently in beta.
Shows everyone who started a trial in the chosen period and their final status by the end of that period.
Filters
- View button with date range filters (from and to).
Funnel Visualization
A visual funnel showing the conversion flow:
- Trial started → Trial ended → Trial won / Trial lost
Each stage shows count and percentage.
Trial List
Each trial card shows:
| Field | Description |
|---|---|
Type | Booking number with status badges (e.g. "Trial Started", "Moved", "By Client", "Trial Won", "Trial Lost"). |
Client | Client name, avatar, email, and phone (with verification ticks). |
Attendee | Child name, date of birth, and age. |
Programme / Class | Programme name, class name, date, and location. |
Internal note | Notes added by staff. |
Power BI Integration (PRO)
When enabled, Zooza pushes daily data to your own data storage so you can build custom reports on raw data.
Button: Activate — enable the Power BI integration.
Session Notifications
Navigation: Reports → Session Notifications → View.
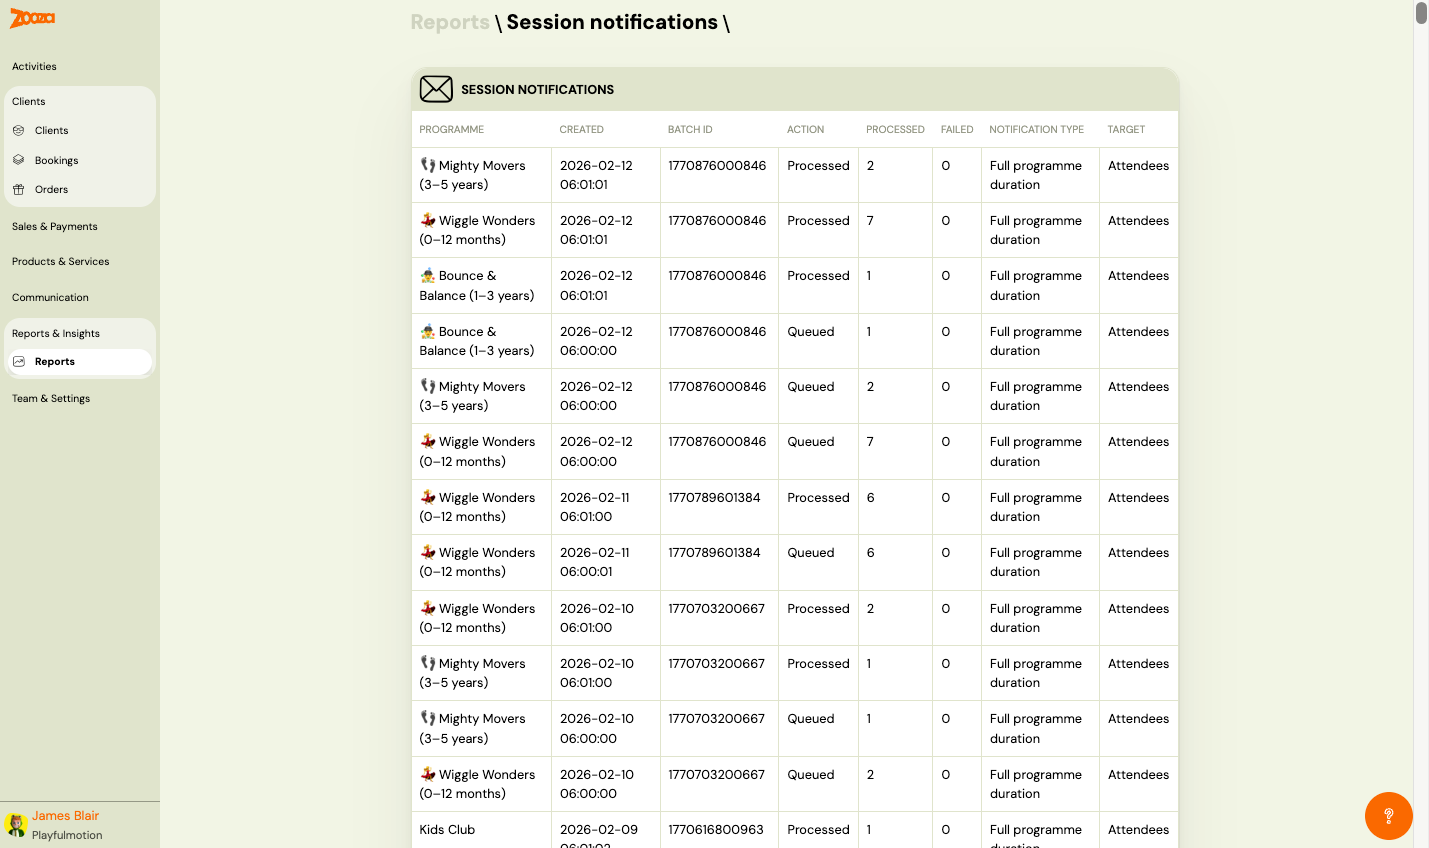
A log of automated session notification emails sent to clients.
| Column | Description |
|---|---|
Programme | Programme name with icon. |
Created | Timestamp of notification creation. |
Batch ID | Internal batch identifier. |
Action | Processing status — "Processed" or "Queued". |
Processed | Number of notifications processed. |
Failed | Number of failed notifications. |
Notification type | Type — e.g. "Full programme duration". |
Target | Target audience — e.g. "Attendees". |
The dashboard card shows the latest date with processed and failed counts.
Related
- Payments Reference — detailed payment reports.
- Dashboard Reference — admin home screen.